Free Power BI Trial
Microsoft offers a 60-day free trial of Power BI. Follow the instructions on the Microsoft Site to sign up and start to explore the tool.
Interacting with Power BI Data

Once published to the web, there's not a lot you can do to break a Power BI Report. Feel free to click around - the visuals should adjust to reflect whatever you click on. If you hold CTRL and click again, you can add to your filters.
If you change a bunch of filters and just want to get it back to how it was, there is a Reset button in the top right that will put it back to the default.
When there's potential for a visual to extend off of the page, I generally give the ability to enter Focus Mode. You can access this by hovering over or clicking on the visual. In the top right, the focus mode icon should appear and if you click that, the visual will expand to take up the whole report area.
We might never fully get out of Excel. Fortunately, Power BI has functionality that lets you pull data down into Excel as a table or pivot table. That lets Power BI do the heavy lifting on the calculations, while you get the flexibility you need.
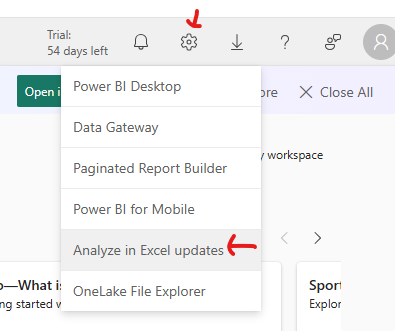
In Power BI Service, click the gear in the top right, then Analyze in Excel Updates. Then click Download.
Once downloaded, open the program to run it. Click through the installation guide to install.
You’ll then need to close all the way out of Excel, but when you open it next, go to the Data ribbon, then Get Data > From Power Platform > From Power BI. You will see (or may need to search for) datasets along the right side. Choose to Insert PivotTable or Insert Table. If necessary, log in using your Microsoft credentials.
Analyze in Excel